Network rewiring on SalmoNet 2 data in Cytoscape
Prerequisites
> An up-to-date version of Cytoscape, available from: https://cytoscape.org/
Downloading data
> Download SalmoNet data from the website: http://salmonet.org/download
> Select the Strain, Layer, and output Format, and click on the Download button.
Calculating network rewiring
Installing and loading DyNet
Network rewiring entails many approaches aimed at quantifying changes between interaction networks, and has been utilised in the past to highlight the specific differences between similar interaction networks (Mehta et al. 2021; Treveil et al. 2020). In this work, we compared the degree of interaction rewiring between the interactomes of host adapted typhoidal Salmonella strains and gastrointestinal Salmonella strains to explore the utility of a multi-layered network resource such as SalmoNet2. To calculate network rewiring in the same manner as shown in the SalmoNet2 publication, one has to download the DyNet application from the Cytoscape app store first (https://apps.cytoscape.org/apps/dynet. This can be done directly from the webpage (which will show a prompt to open Cytoscape), or from within Cytoscape. In the latter case, select Apps → App Manager ..., which will return the following window:
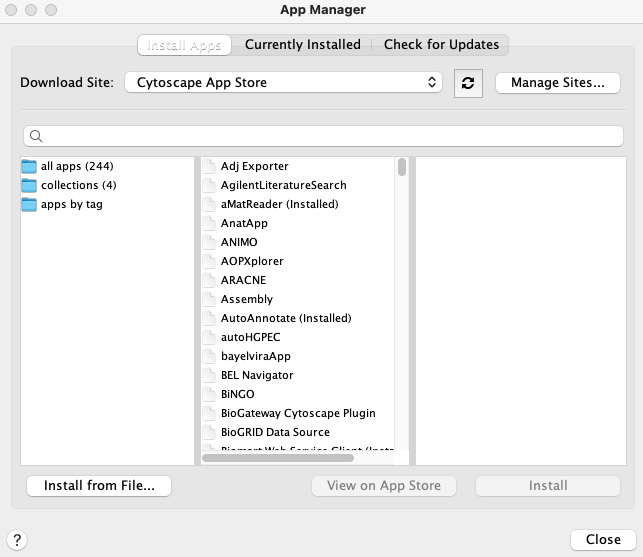
For a better resolution, please click on the image
Typing "DyNet" into the search box will list the application, and it can be installed by clicking on the 'Install' button.
To calculate rewiring we will need to load multiple .csv or PSI-MITAB networks we would like to compare. When selecting source and target columns, please select the orthology group ID columns, as these are the only identifiers we will be able to match our networks on. Please refer to the Importing data section for more details. Once multiple networks have been loaded, activate the DyNet application by clicking on Apps → DyNet Analyzer1. A window will appear:
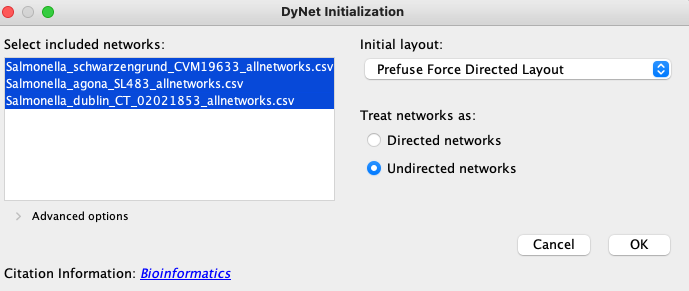
For a better resolution, please click on the image
By default all networks will be selected. Networks should be treated as directed or undirected according to the layer type: PPI networks are undirected, regulatory and metabolic layers are directed. Clicking on OK will bring up the main DyNet window:
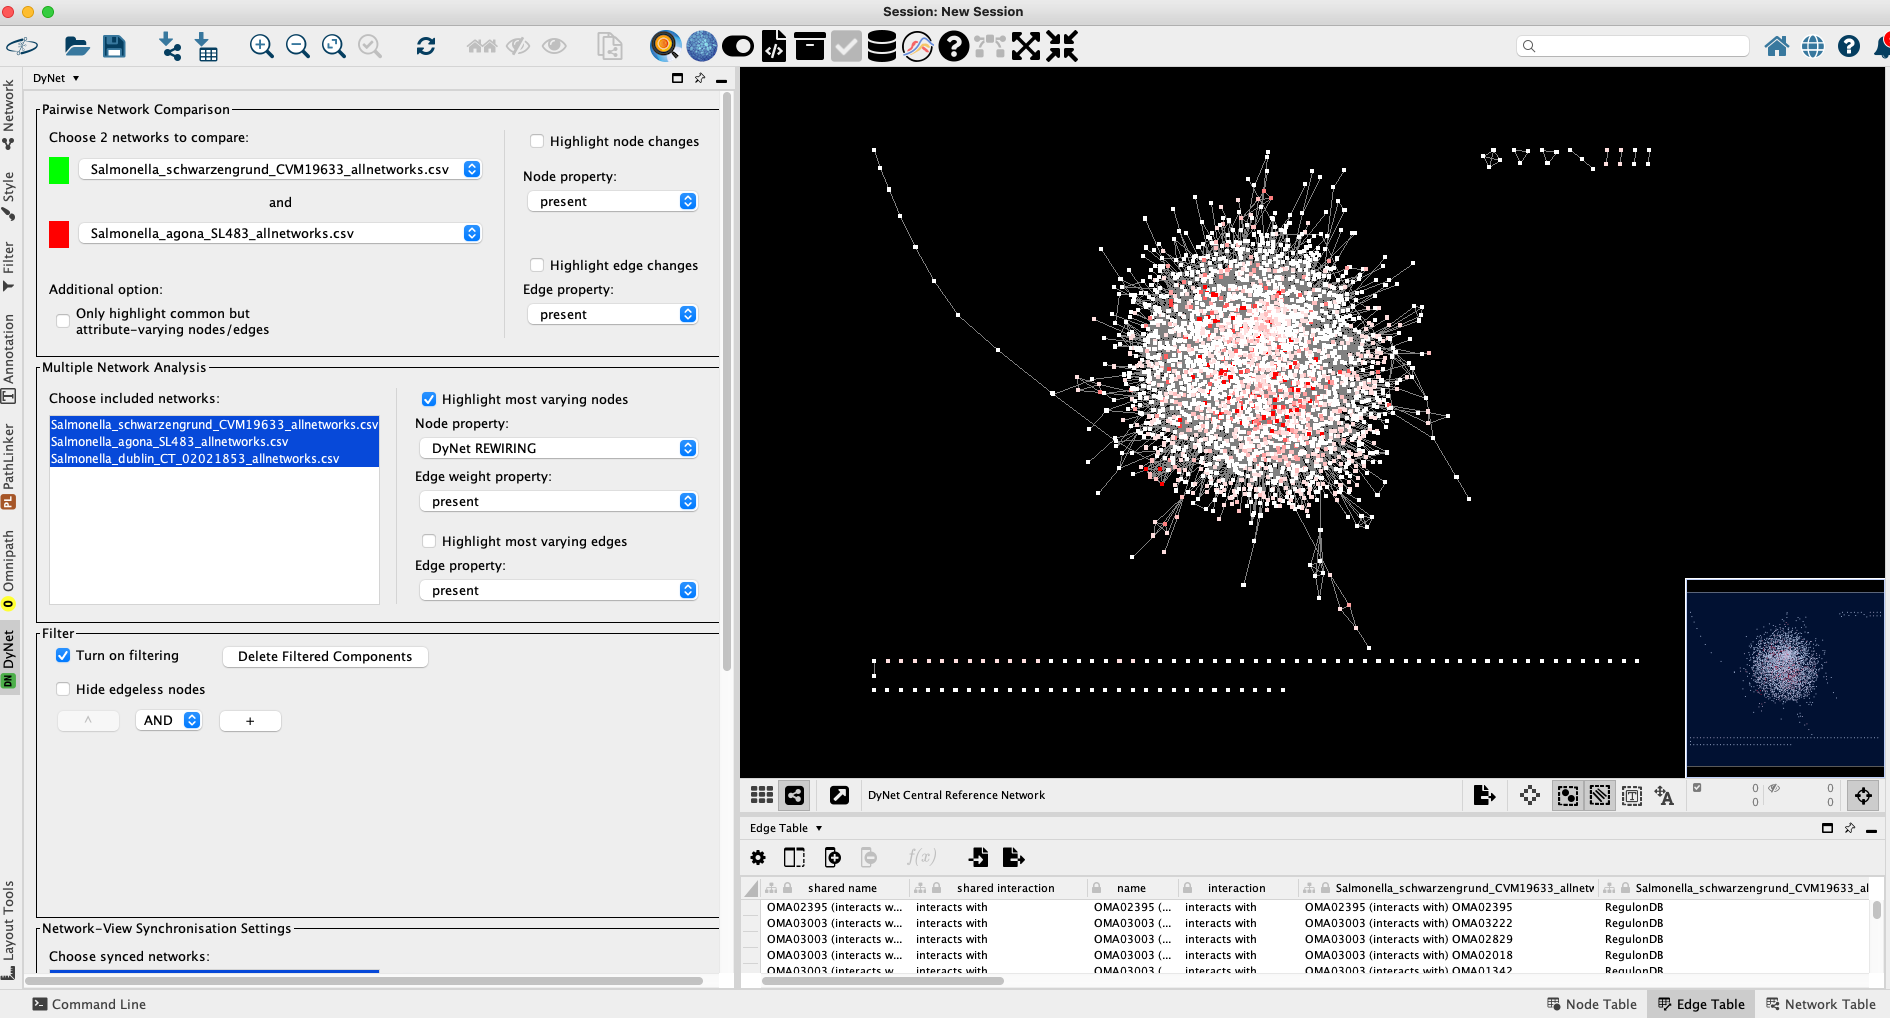
For a better resolution, please click on the image
When working with more than 2 networks, by default Multiple Network Analysis is selected. However, once loaded, users can select any subset of networks they wish to compare, which updates the rewiring values in real time. By shift-clicking on S. Agona and S. Schwarzengrund and toggling the Pairwise Network Comparison options on the top I can proceed with pairwise network analysis. Here, the colour-coding details the specific binary node and edge differences between the two networks. The Dn rewiring values will be also more discrete: -Inf, 0, and +Inf referring to the absent, matching, and additional interactions when comparing the two networks respectively.
Selecting all three networks again and toggling Highlight most varying nodes lets us compare the three Salmonella networks simultaneously.
For a better resolution, please click on the image
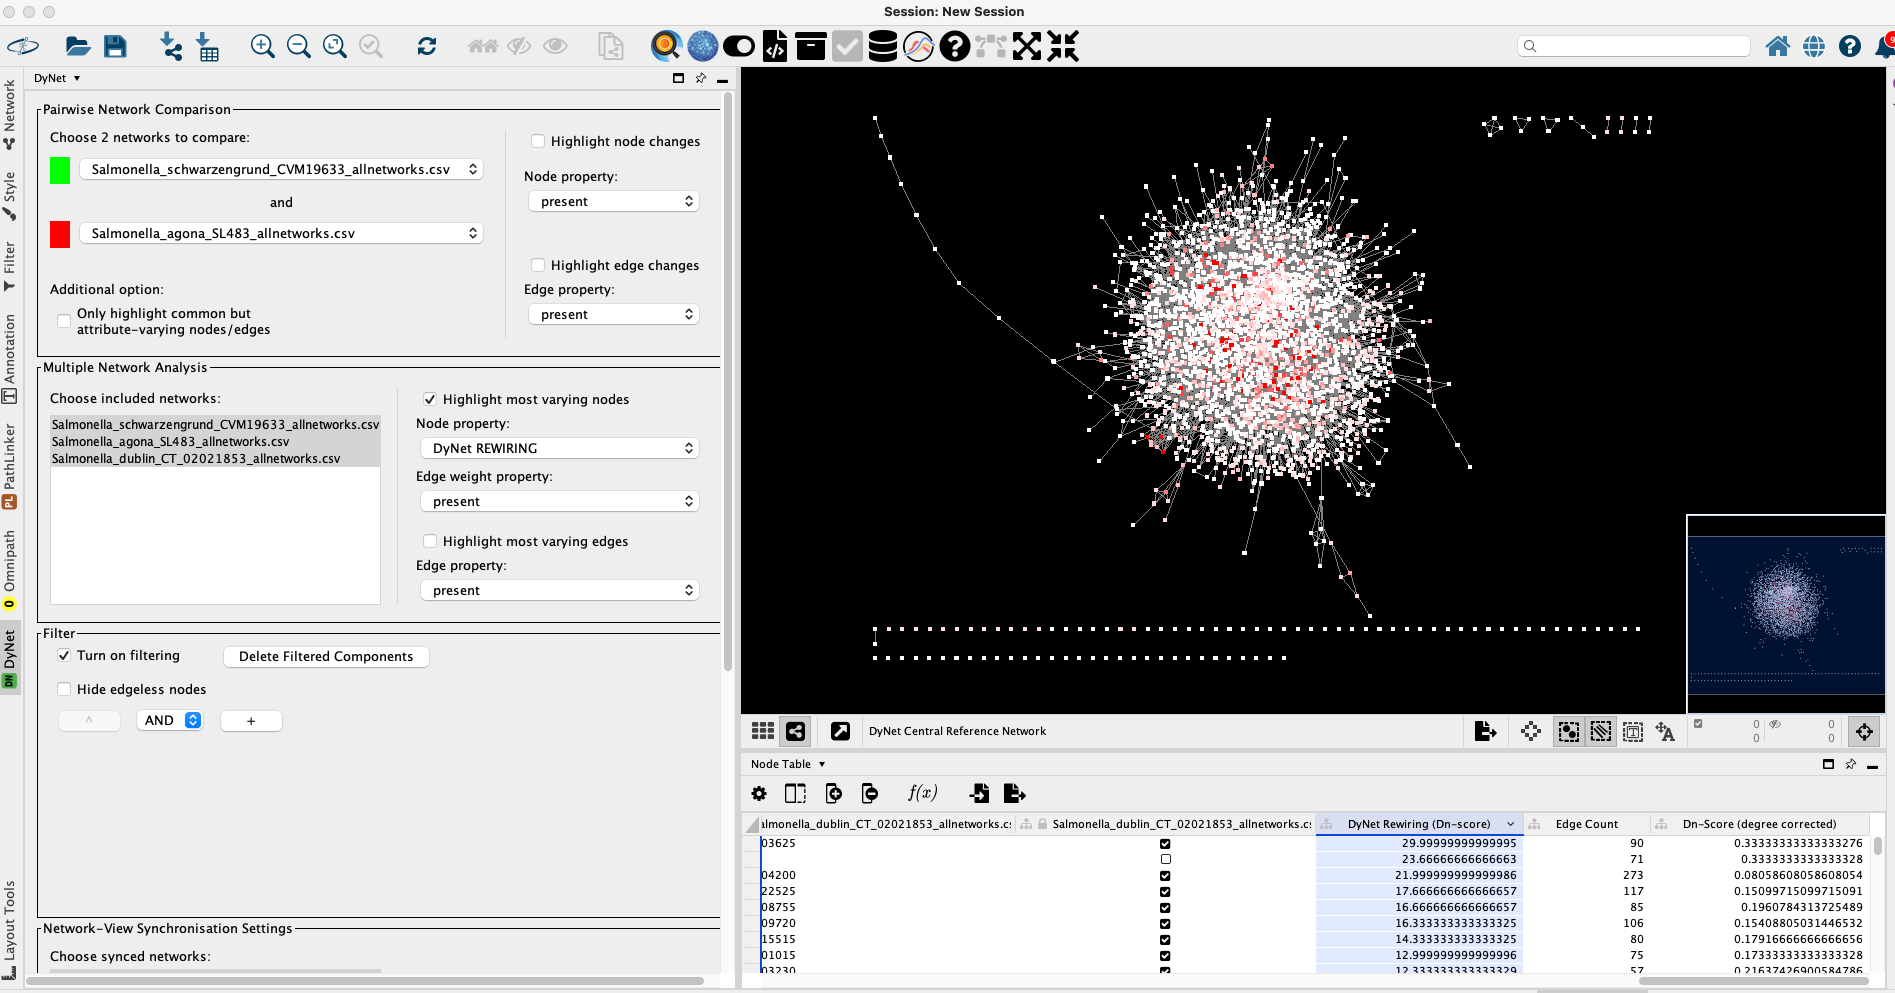
The resulting rewiring values can be sorted in the Node table, and the top n hits can be further analysed in detail. Selecting a node of interest, and right clicking on it brings up a context menu, where after selecting Apps → DyNet Node Analyzer the immediate interactome of the selected node can be analysed in detail.

For a better resolution, please click on the image
The Node analyzer pane lists the interactions present between the selected node and its first neighbours, and the status of these interactions in the compared networks. In this specific example OMA01179 is missing from S. Schwarzengrund altogether, and as such all further interactions are absent. DyNet synchronises the positions of the nodes and edges across all networks, making visual comparisons easier, as seen on the right of the figure. This multi-network pane can be toggled by clicking on the Grid icon onthe bottom of the main window.
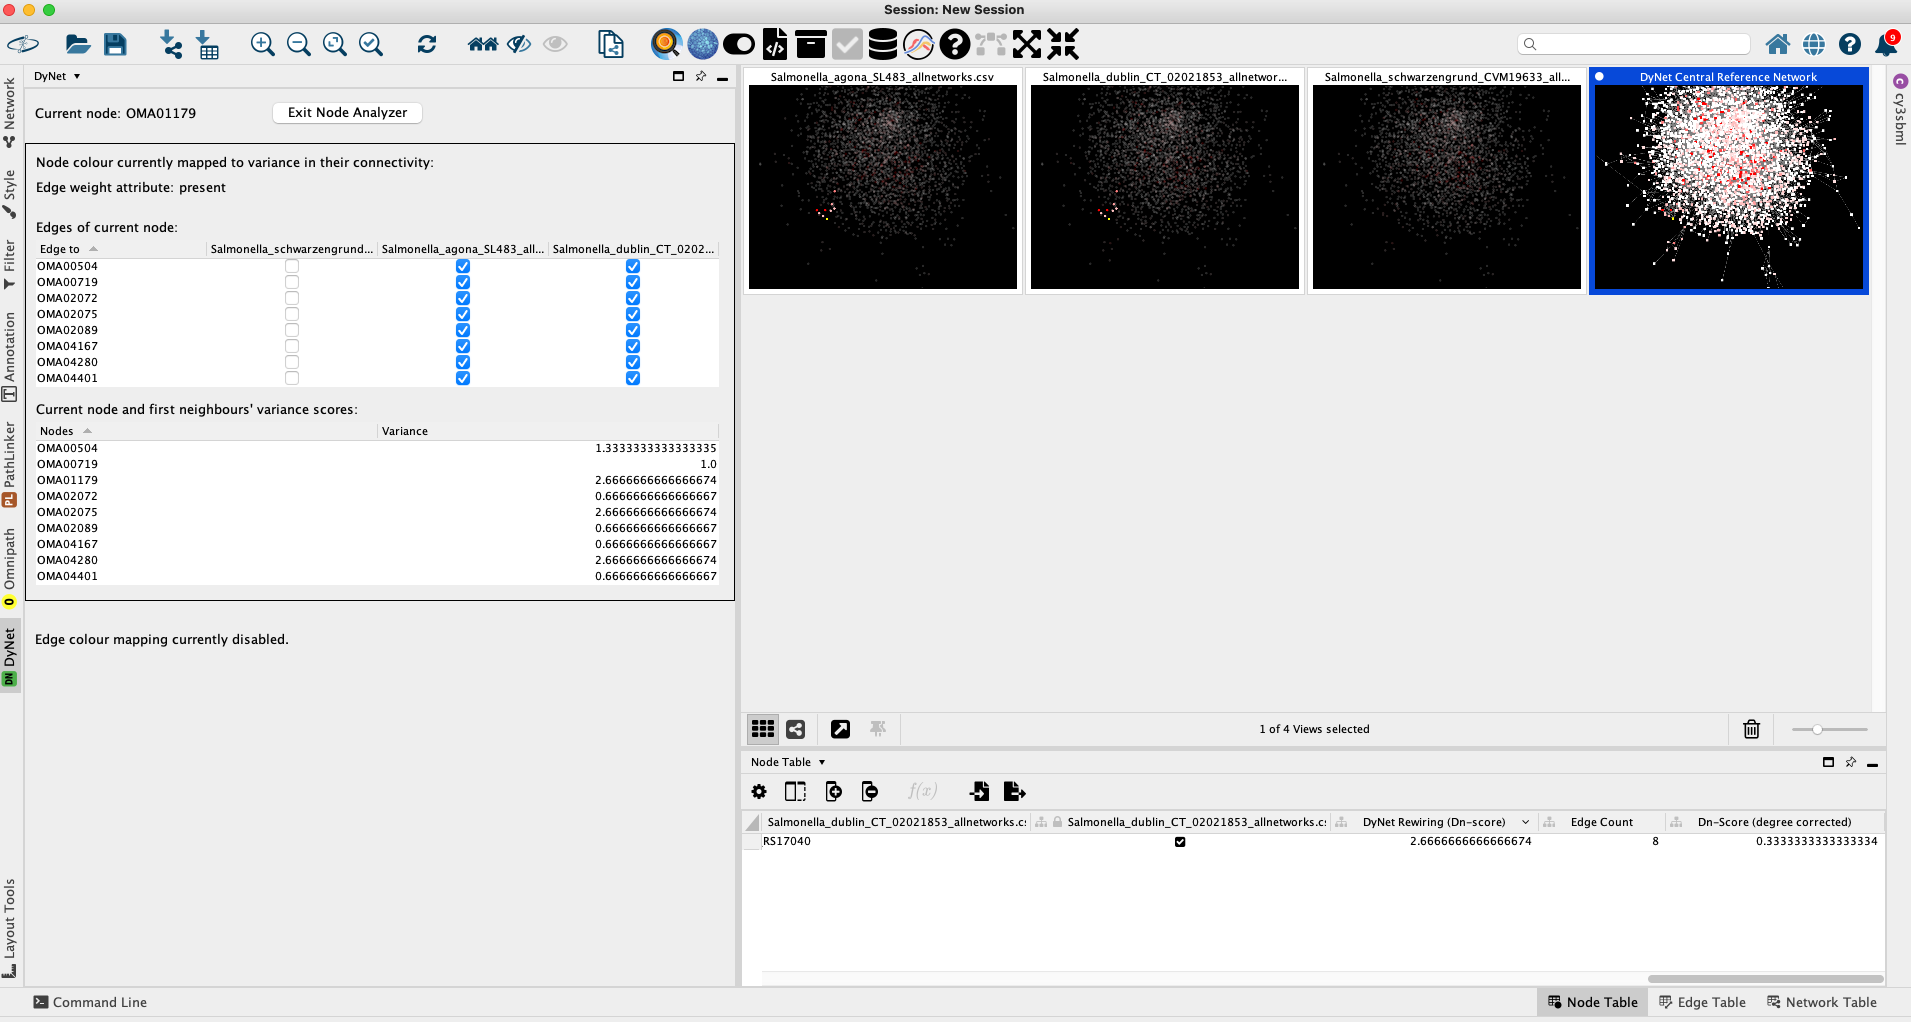
For a better resolution, please click on the image
The results of the rewiring analysis can be exported from Cytoscape by clicking on File → Export → Table to File .... Make sure to select the DyNet Central Reference Network default node table to import, as this table holds the node rewiring data. The results will be saved in a convenient .csv format readable by Microsoft Excel and other similar software.
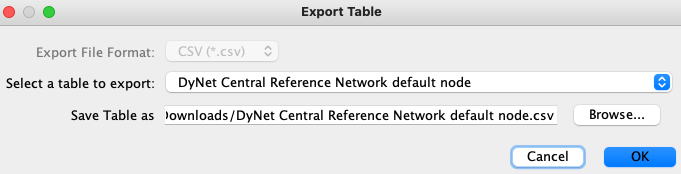
For a better resolution, please click on the image
1: There is an option titled DyNet Network Importer among the addons, allowing the user to import multiple networks at the same time. However, this requires a special file format that SalmoNet2 does not supply. For more details please refer to the DyNet documentation at https://apps.cytoscape.org/apps/dynet
Mehta TK, Koch C, Nash W, Knaack SA, Sudhakar P, Olbei M, Bastkowski S, Penso-Dolfin L, Korcsmaros T, Haerty W, Roy S, Di-Palma F. Evolution of regulatory networks associated with traits under selection in cichlids. Genome Biol. 2021 Jan 8;22(1):25. doi: 10.1186/s13059-020-02208-8. PMID: 33419455; PMCID: PMC7791837.
Treveil A, Sudhakar P, Matthews ZJ, Wrzesiński T, Jones EJ, Brooks J, Ölbei M, Hautefort I, Hall LJ, Carding SR, Mayer U, Powell PP, Wileman T, Di Palma F, Haerty W, Korcsmáros T. Regulatory network analysis of Paneth cell and goblet cell enriched gut organoids using transcriptomics approaches. Mol Omics. 2020 Feb 17;16(1):39-58. doi: 10.1039/c9mo00130a. PMID: 31819932.